|
Top 10 IT Monitoring software
August 04, 2025 | Editor: Michael Stromann
19
IT infrastructure monitoring software allows IT administrators to view entire IT infrastructure in real-time.
1
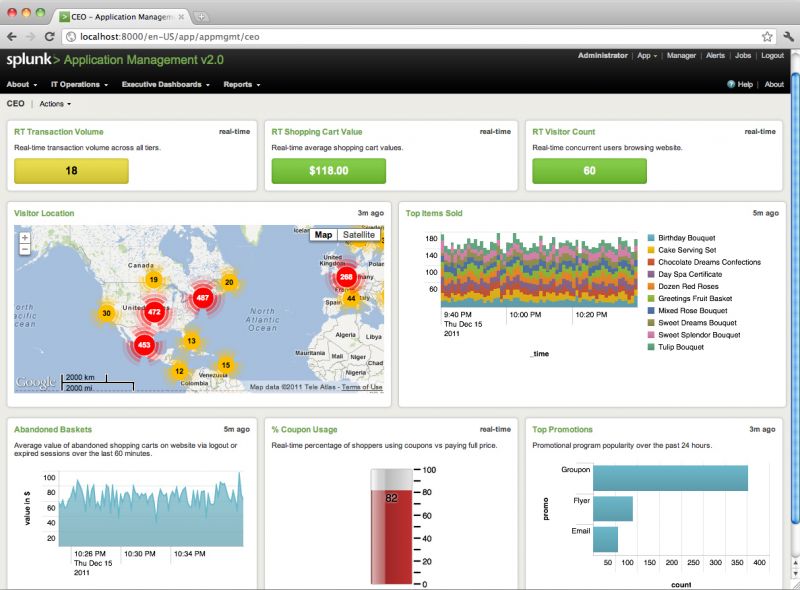
We make machine data accessible, usable and valuable to everyone—no matter where it comes from. You see servers and devices, apps and logs, traffic and clouds. We see data—everywhere. Splunk offers the leading platform for Operational Intelligence. It enables the curious to look closely at what others ignore—machine data—and find what others never see: insights that can help make your company more productive, profitable, competitive and secure.
2
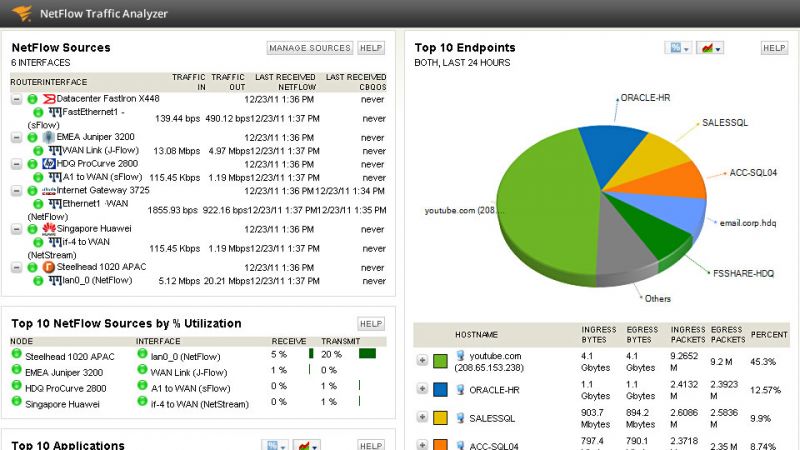
Monitor & manage your network with unified visibility into fault, performance, availability, traffic, & configurations. Get instant visibility across all system resources that can impact application performance and fix them fast. Find, analyze & resolve your toughest performance issues on SQL Server, Oracle, Sybase, and DB2. Automate 24x7 security monitoring and response to stop threats in their tracks and maintain continuous compliance.
3
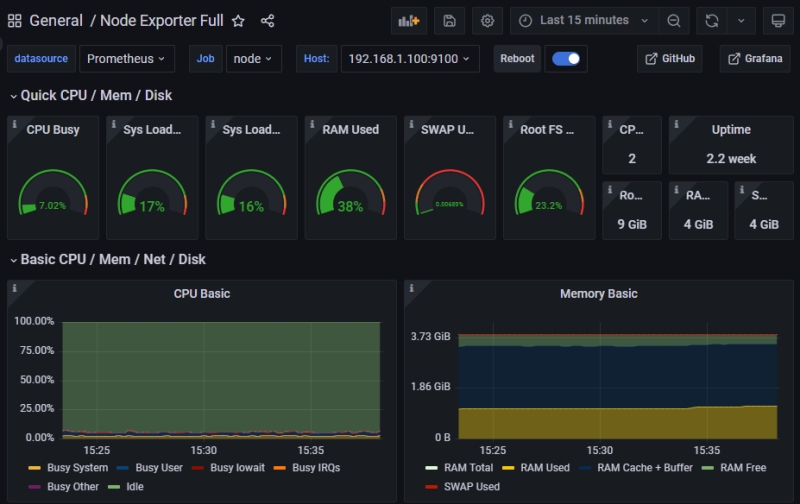
An open-source monitoring system with a dimensional data model, flexible query language, efficient time series database and modern alerting approach.
4
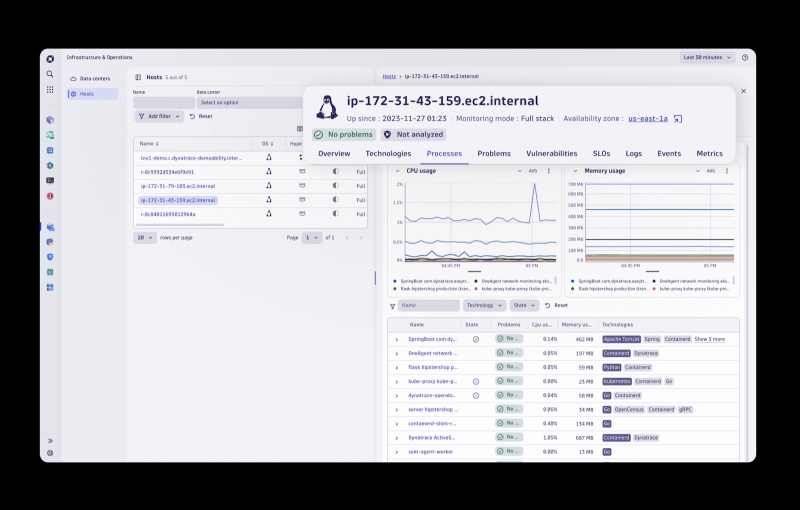
Cloud monitoring reinvented. Easy, Automatic, AI-Powered. Automatically monitor dynamic hybrid-cloud environments.
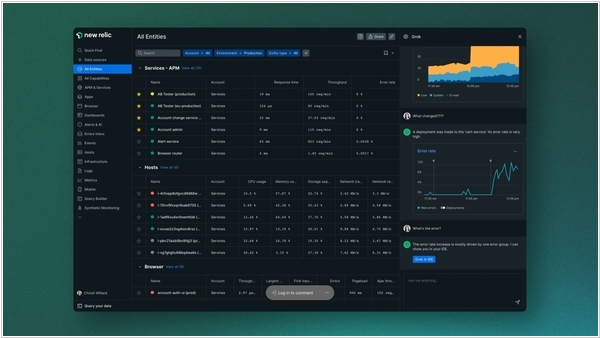
5
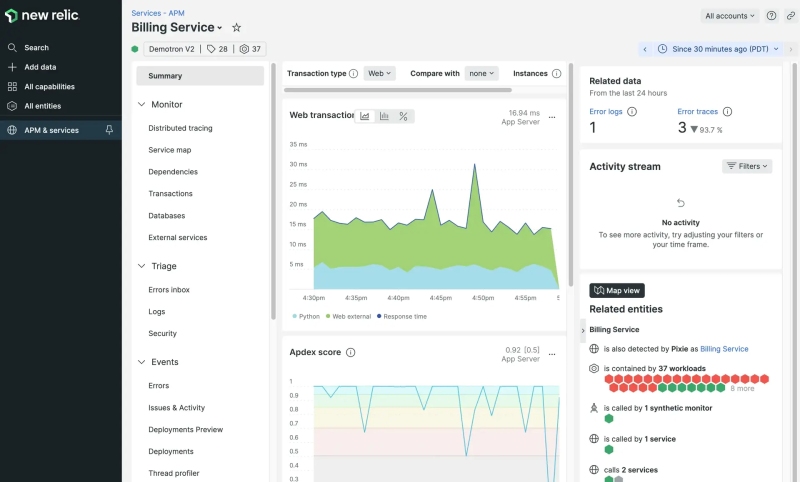
New Relic gets you immediate code-level visibility to build faster software, create better products, and delight your customers. New Relic gets you immediate code-level visibility to build faster software, create better products, and delight your customers.
6
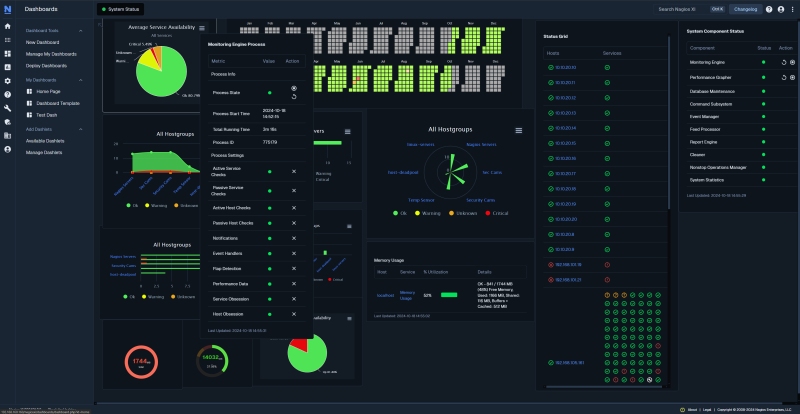
Nagios Is The Industry Standard In IT Infrastructure Monitoring. Achieve instant awareness of IT infrastructure problems, so downtime doesn't adversely affect your business. Nagios offers complete monitoring and alerting for servers, switches, applications, and services.
8
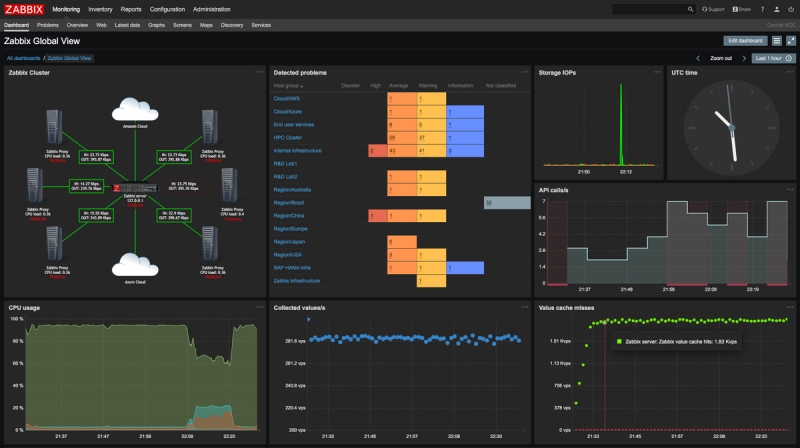
Zabbix is a mature and effortless enterprise-class open source monitoring solution for network monitoring and application monitoring of millions of metrics.
9
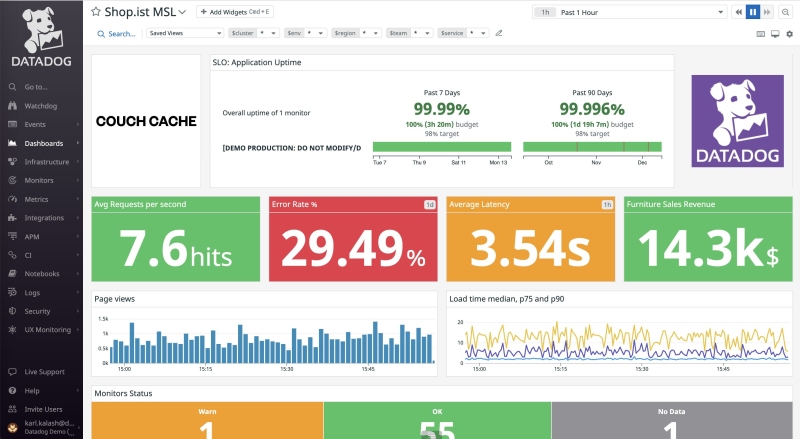
Datadog is a monitoring service for IT, Operations and Development teams who write and run applications at scale, and want to turn the massive amounts of data produced by their apps, tools and services into actionable insight.
10
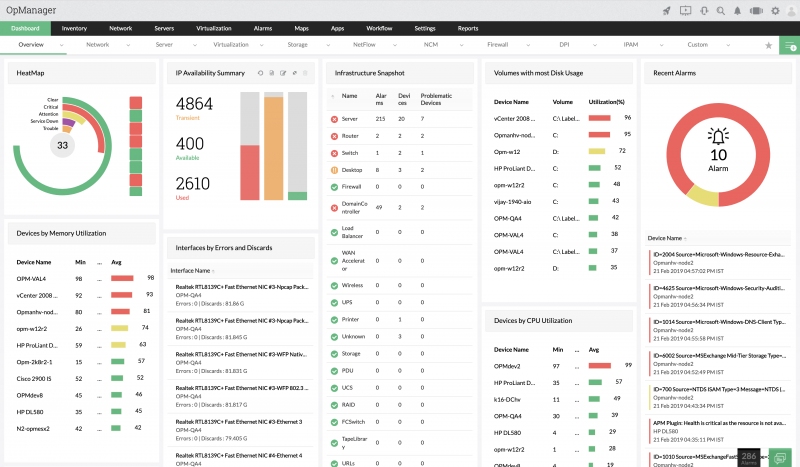
ManageEngine crafts comprehensive IT management software for all your business needs. We have complete and easy solutions for even your most difficult IT management problems, from keeping your business safe, to ensuring high availability, to making your users happy. We’re bringing IT together so you don’t have to.
11
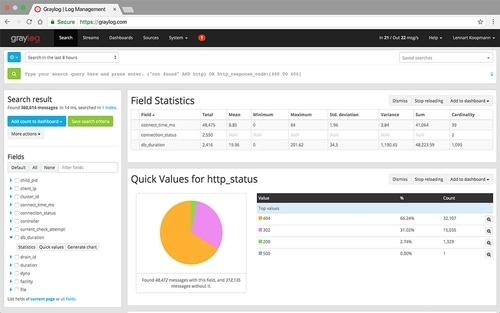
Graylog is a leading centralized log management solution for capturing, storing, and enabling real-time analysis of terabytes of machine data.
12
PRTG Network Monitor is an agentless network monitoring software. It can monitor and classify system conditions like bandwidth usage or uptime and collect statistics from miscellaneous hosts as switches, routers, servers and other devices and applications.
13
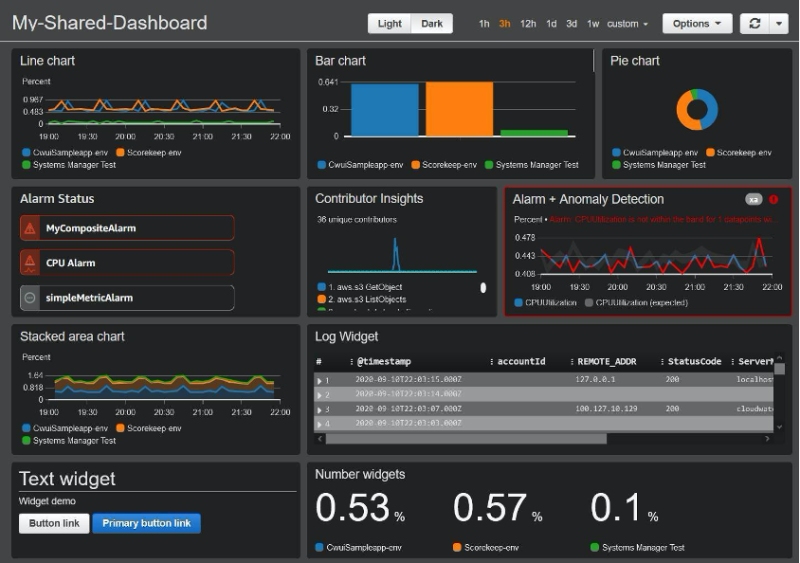
CloudWatch collects monitoring and operational data in the form of logs, metrics, and events, providing you with a unified view of AWS resources, applications, and services that run on AWS and on-premises servers.
14
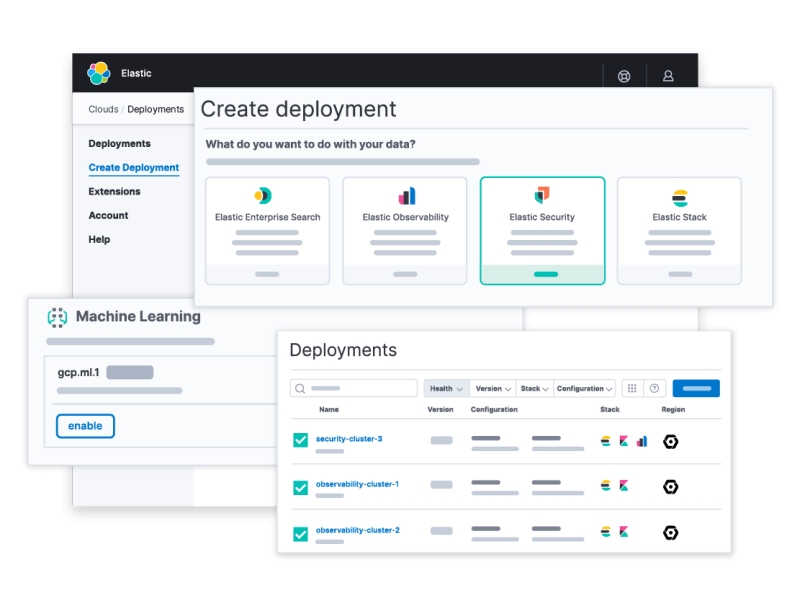
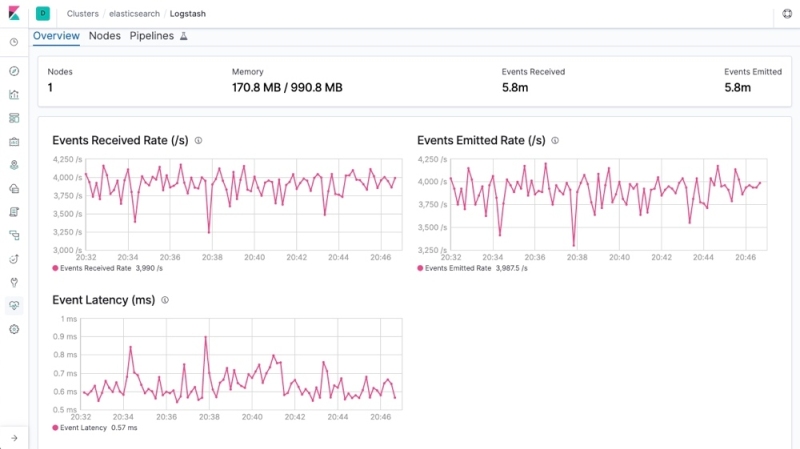
ELK is the acronym for three open source projects: Elasticsearch, Logstash, and Kibana. Elasticsearch is a search and analytics engine. Logstash is a server‑side data processing pipeline that ingests data from multiple sources simultaneously, transforms it, and then sends it to a "stash" like Elasticsearch. Kibana lets users visualize data with charts and graphs in Elasticsearch.
15
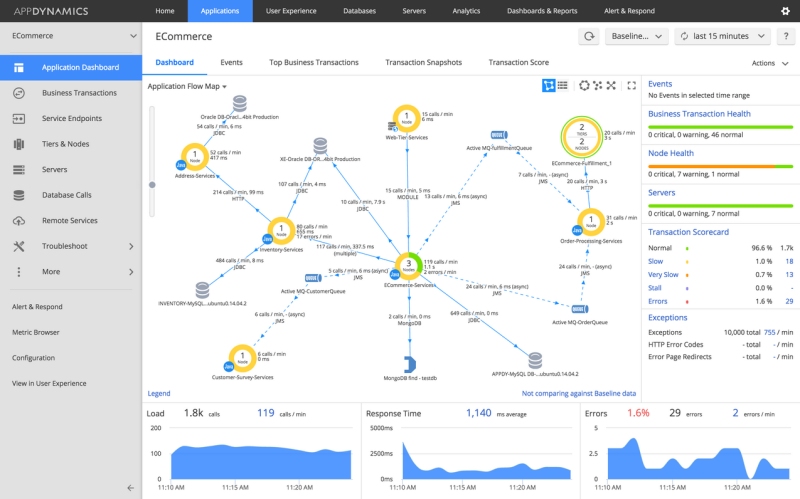
Cisco's AppDynamics is an application performance management and IT operations analytics software. Get real-time insights and transform your app performance with our Application Performance Management to drive business outcomes.
16
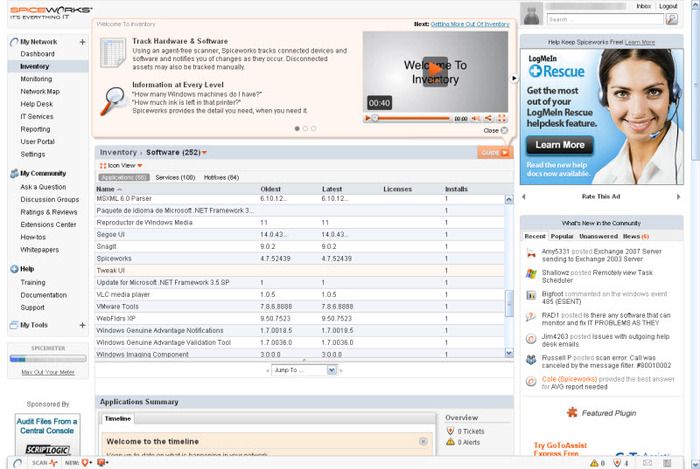
Spiceworks bundles network monitoring, helpdesk, UPS power management, PC inventory tools, an online community, and much more. All in one spot. All for free.
17
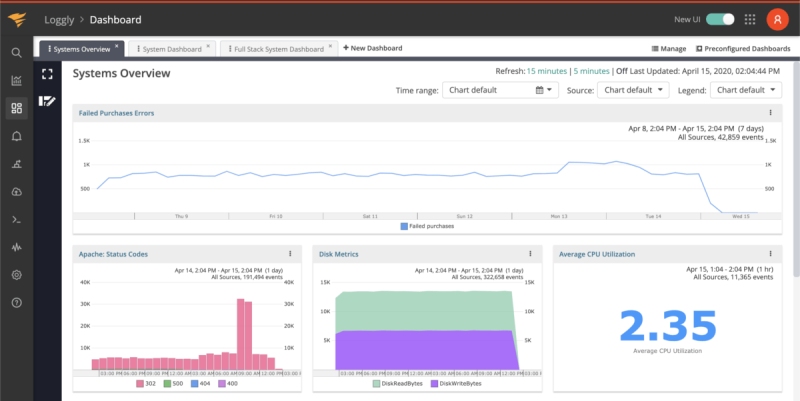
Solve Operational Problems Faster. Make all of your logs accessible to everyone in one place. No more logging into individual machines. Use searches, filters and graphs to spot trends and narrow down potential root causes. Set up in minutes. No software or agents to install. Works with all standard logging facilities. Owned by SolarWinds.
18
logstash is a tool for managing events and logs. You can use it to collect logs, parse them, and store them for later use (like, for searching). Speaking of searching, logstash comes with a web interface for searching and drilling into all of your logs.
19
Sumo Logic cloud log management solution processes ALL your production application logs and server log data, analyzes them in real-time and delivers actionable results at a fraction of the cost of on-premise solution.
21
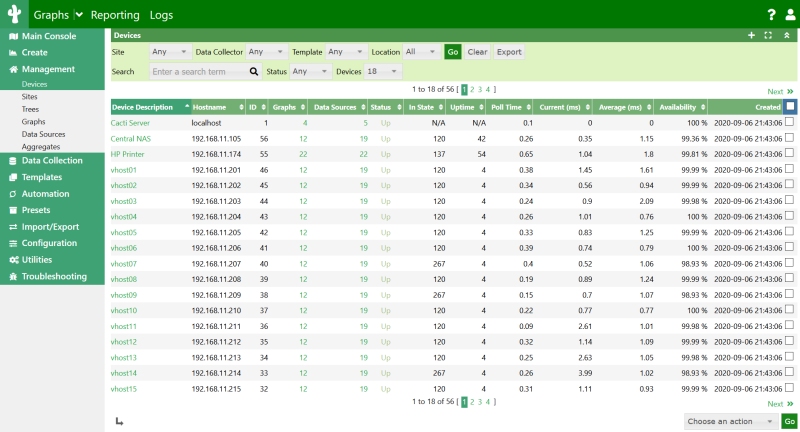
Cacti is an open-source, web-based network monitoring and graphing tool designed as a front-end application for the open-source, industry-standard data logging tool RRDtool. Cacti allows a user to poll services at predetermined intervals and graph the resulting data.
22
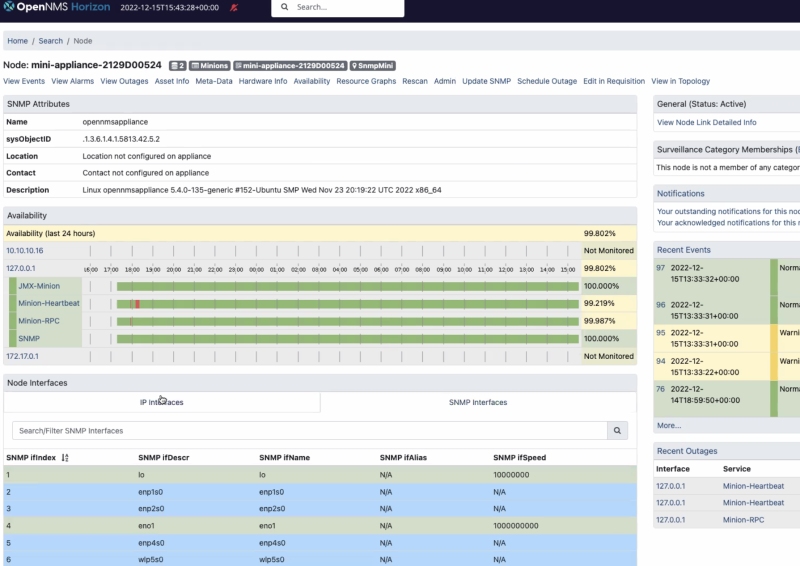
OpenNMS is a free and open-source enterprise grade network monitoring and network management platform.
23
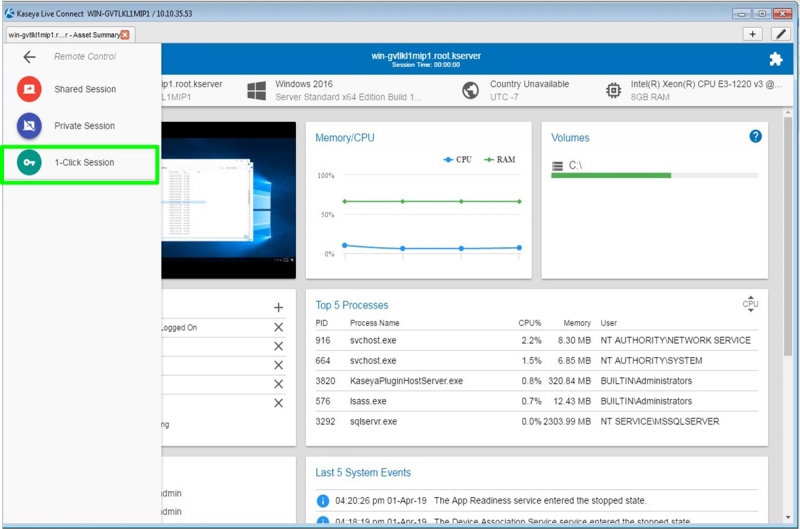
Kaseya helps MSPs and IT Departments better manage their business with our IT management software suite, IT Complete.
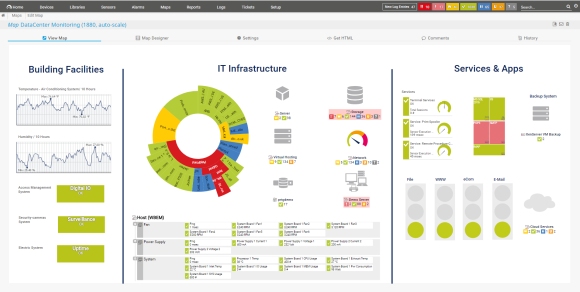
24
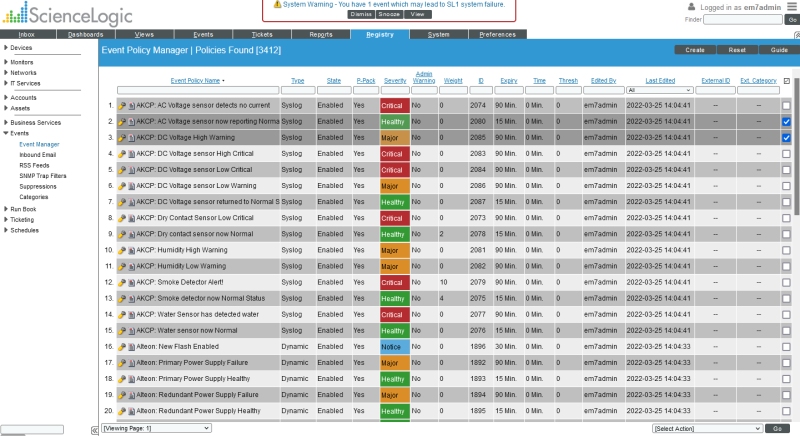
ScienceLogic’s solution is an all-in-one IT monitoring software product, comprehensive and complete in a single, unified platform. Unlike some companies, we do not sell you a la carte, piecemeal selections. To help you understand the many powerful components of our solution, we have broken out descriptions of features and capabilities that other companies call (and sell) as individual products:
25
syslog-ng is the foundation of log collection and management. Optimize your SIEM, meet compliance requirements, and deliver data from a variety of sources.
26
Server Log Monitoring Tool. We built the log monitoring tool we've always wished for. Scalyr is server log monitoring and analysis built for engineers. Turn chaotic logs and system metrics into actionable data.
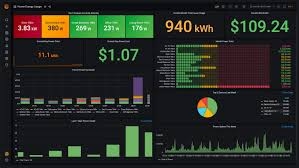
27
Graphite is an enterprise-ready monitoring tool that runs equally well on cheap hardware or Cloud infrastructure. Teams use Graphite to track the performance of their websites, applications, business services, and networked servers. It marked the start of a new generation of monitoring tools, making it easier than ever to store, retrieve, share, and visualize time-series data.
28
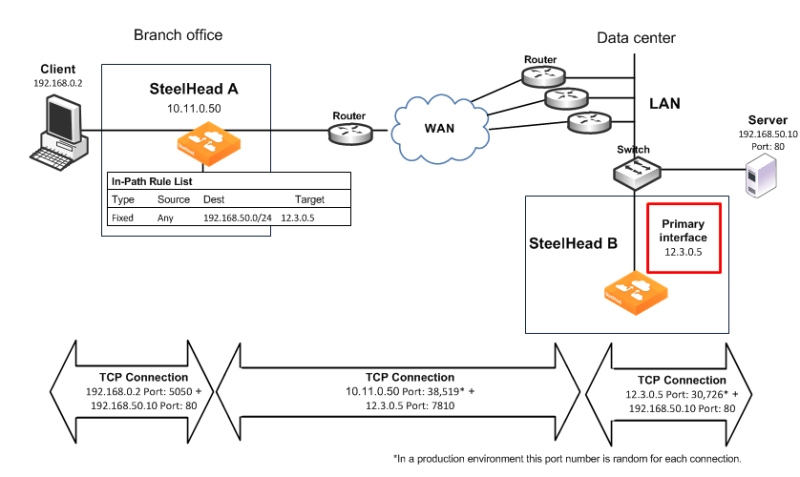
The Riverbed Network and Application Performance Platform enables organizations to visualize, optimize, accelerate and remediate the performance of any network for any application.
29
Network performance monitoring that goes beyond your network. AppNeta provides real-time, actionable insight from remote offices, over internal networks, and across the internet, so you can quickly get to the bottom of performance issues regardless of where they occur.
30
One platform, unlimited metrics. Monitoring Zen. We get your data flowing to us from anywhere, whether it's through our API, a turn-key solution, or one of our many open source collection agents. Turn your raw data into intuitive metrics with our powerful composite metric defi-nitions. Owned by SolarWinds.
31
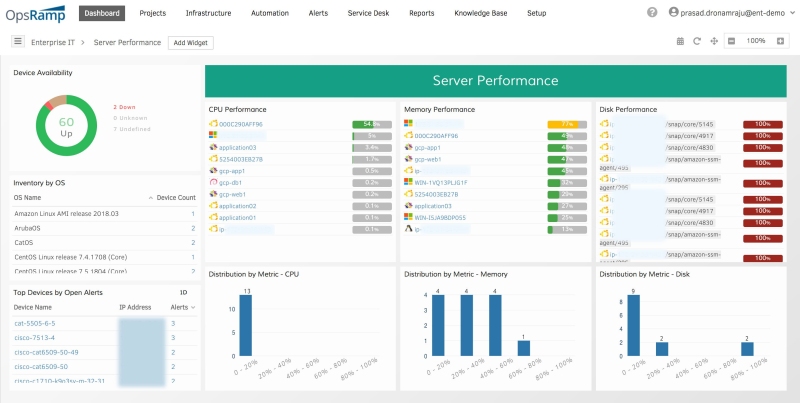
OpsRamp is a service that helps IT teams discover, monitor, manage and automate their hybrid environments
Important news about IT Monitoring software
2023. New Relic launches Grok, its AI observability assistant
Enterprises and related companies are currently in the midst of integrating large language models into their services. New Relic has announced its own offering Grok, which it claims is the first generative AI assistant for observability. The aim is to leverage a large language model to assist engineers in performing routine tasks within New Relic, such as setting up instrumentation, creating reports, and managing accounts using natural language. The use of these models provides a significant advantage in helping engineers analyze the large amounts of data collected by the service, which is crucial not only for ensuring the performance of a given service but also for managing its associated costs - an increasingly important concern for most enterprises.
2022. New Relic enters the security market with its new vulnerability management service
New Relic, which has long been known for its observability platform, is entering the security market today with the launch of a new vulnerability management service. Aptly named New Relic Vulnerability Management, the service aggregates data from both its own native vulnerability detection system and third-party tools, giving security, DevOps, SecOps and SRE teams a single service for monitoring their software stack for vulnerabilities. The company argues that one if its major differentiators is that this new tool can integrate with third-party security tools. This in turn should help teams prioritize which security risks to focus on (because there are always more than any team can handle), with the new service also helping them to identify which actions to take to remediate those risks).
2022. New Relic launches its new infrastructure monitoring experience
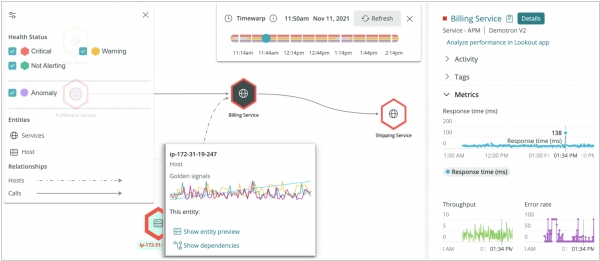
In 2020, New Relic launched its New Relic One platform, its attempt to bring together the many point solutions the company had built over the course of the years under a single umbrella. Last year, New Relic built on top of this — and its NRDB data storage system — with improved network monitoring, an ML model performance monitoring and error tracking tool and more. Today, the company is putting one of the last pieces of this project in place with the general availability of its new infrastructure monitoring experience. Designed to help DevOps, SRE and ITOps teams monitor their infrastructure and quickly resolve issues across public, private and hybrid cloud environments, this new solution is now available to New Relic users.